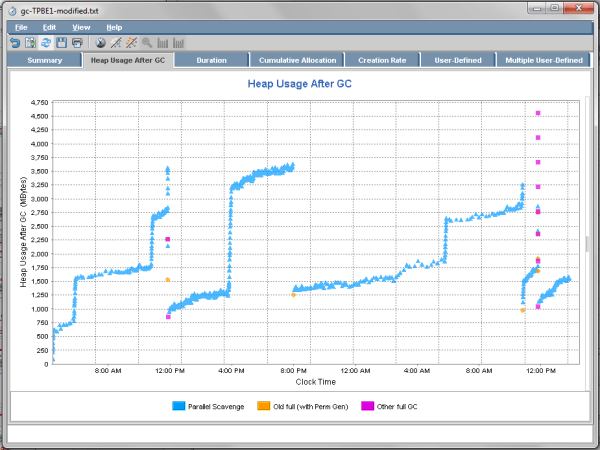
HP Jmeter is a powerful tool to do Garbage Collection Analysis. Even though there are few Garbage collection analysis tool Continue reading “HP Jmeter – GC Analysis Tool”
HP Jmeter – GC Analysis Tool
Build Ultra Available, Highly Scalable, Performant Apps
HP Jmeter is a powerful tool to do Garbage Collection Analysis. Even though there are few Garbage collection analysis tool Continue reading “HP Jmeter – GC Analysis Tool”

To diagnose any memory problems, Garbage Collection log file is the best place to start. It provides several interesting statistics: Continue reading “Understanding Garbage Collection Log”
Continue reading “CPU maxes out and utilization never goes down?”This is an old, outdated article. We have devised a better and simpler strategy to troubleshoot CPU spikes in this article.
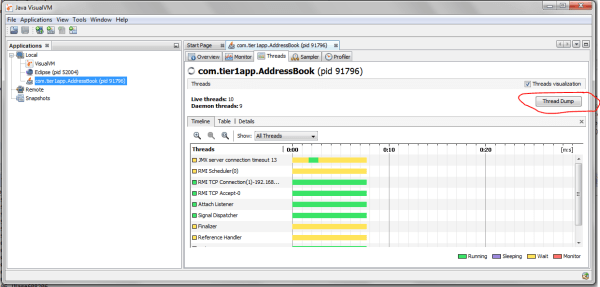
Thread dump is a snapshot of all the threads that were executing at a moment in time. It shows the stack trace of each thread Continue reading “How to capture Thread dump? – jstack, jvisualvm”
Heap dump is a snapshot of the Java memory. It contains information about the Java objects and classes in the heap at the moment Continue reading “How to capture heap dump? – jmap, -XX:+HeapDumpOnOutOfMemoryError”

Memory leaks are dangerous problems which puts entire application’s availability in to question mark. Most of the time Continue reading “Yes, you can catch Memory Leaks during test”
Java developers have affinity to use System.out.println and e.printStackTrace during the development phase. Continue reading “Often dismissed silly things – System.out.println and e.printStackTrace”

I was surprised to witness the Java Executor behavior – which caused Continue reading “Memory Leak in Java Executor!”
Spring IOC Container wires the dependencies among the beans and returns the fully built bean tree to the caller. Continue reading “Spring IOC Container – Performance Problem”

Description
You might have experienced the application’s CPU to spike up suddenly & spike wouldn’t go down until JVM is recycled. Continue reading “Thread Dump Analysis Pattern – THREAD MILL”

Description
Thread-A could have acquired the lock-1 and then would never release it. Thread-B could have acquired lock-2 Continue reading “Thread Dump Analysis Pattern – Traffic Jam”
Description
Based on the type of GC algorithm (Serial, parallel, G1, CMS) used, default number of garbage collection threads Continue reading “THREAD DUMP ANALYSIS PATTERN – Several Scavengers”
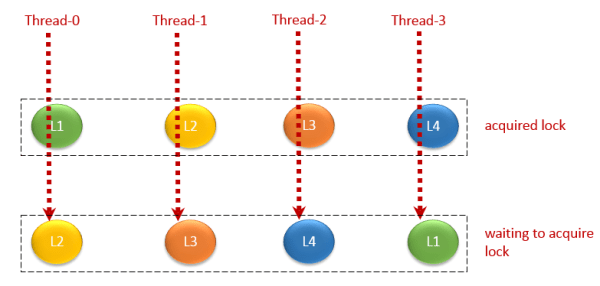
Description
Dinning Philosophers is a classic computer science problem that happens in concurrent programming. Continue reading “Circular Deadlock”
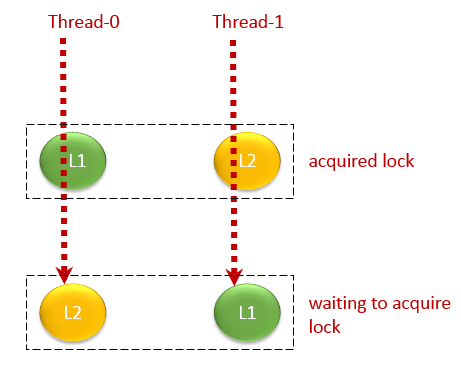
Description
Wikipedia aptly defines deadlock is a situation in which two or more competing actions are each waiting Continue reading “Deadlock”

Description
Unlike other objects, GC process will not immediately garbage collect the objects which has finalize method implemented Continue reading “THREAD DUMP ANALYSIS PATTERN – LEPRECHAUN TRAP”
If you are using Spring HTTP Remoting to communicate between your applications, sometimes you might want to Continue reading “Spring HTTP Remoting – pass custom HTTP header elements”

Description
In thread dump analysis, one of the key parameter to watch out is: Thread Count. You need to know the application’s thread count Continue reading “THREAD DUMP ANALYSIS PATTERN – STOCK TICKER”

Description
It’s highly recommended to capture 3 threads dumps in an interval of 10 seconds to uncover any problem in the JVM. Continue reading “THREAD DUMP ANALYSIS PATTERN – ADDITIVES”

Description
Whenever significant number of threads exhibit same/repetitive stack trace then those stack trace has to be investigated. Continue reading “THREAD DUMP ANALYSIS PATTERN – REPETITIVE STRAIN INJURY (RSI)”

Description
If several threads in a thread dump ends up working on one single method, then it might be of concern. Most of the times Continue reading “THREAD DUMP ANALYSIS PATTERN – ALL ROADS LEAD TO ROME”
