To diagnose any memory problems, Garbage Collection log file is the best place to start. It provides several interesting statistics:
- When scavenge (or Young generation) GC process ran?
- When full GC process ran?
- How many scavenge GCs and Fulls GCs ran? Did they run repeatedly? In what interval?
- After GC process run, how much memory was reclaimed in Young, Old and Permanent generations?
- How long did GC run?
- What was the total allocated memory in each generation?
How to generate GC Log file?
In order to understand GC log, you first need to generate one. Passing the below mentioned system properties to your JVM would generate GC logs.
-XX:+PrintGCDetails -XX:+PrintGCDateStamps -Xloggc:

where file-path: Garbage Collection log file path.
Example:
-XX:+PrintGCDetails -XX:+PrintGCDateStamps -Xloggc:/opt/app/gc.log
-XX:+PrintGCDateStamps would print the absolute time stamp in the log statement i.e. “2014-11-18T16:39:25.303-0800”
-XX:+PrintGCDetails property would print the details of how much memory is reclaimed in each generation
Passing above system properties would generate Garbage Collection log file that would look like:
2014-11-18T16:39:25.512-0800: 76.592: [Full GC [PSYoungGen: 26560K->0K(233024K)] [PSOldGen: 632024K->658428K(699072K)] 658584K->658428K(932096K) [PSPermGen: 2379K->2379K(21248K)], 3.0978612 secs] [Times: user=3.09 sys=0.00, real=3.10 secs]

2014-11-18T16:39:31.536-0800: 82.616: [Full GC [PSYoungGen: 116544K->0K(233024K)] [PSOldGen: 658428K->684832K(699072K)] 774972K->684832K(932096K) [PSPermGen: 2379K->2379K(21248K)], 3.2582136 secs] [Times: user=3.23 sys=0.03, real=3.26 secs]

2014-11-18T16:39:37.728-0800: 88.808: [Full GC [PSYoungGen: 116544K->12164K(233024K)] [PSOldGen: 684832K->699071K(699072K)] 801376K->711236K(932096K) [PSPermGen: 2379K->2379K(21248K)], 3.4230220 secs] [Times: user=3.40 sys=0.02, real=3.42 secs]
:
:
Heap
 PSYoungGen total 233024K, used 116544K [0x00000000eaab0000, 0x0000000100000000, 0x0000000100000000)
 eden space 116544K, 100% used [0x00000000eaab0000,0x00000000f1c80000,0x00000000f1c80000)
 from space 116480K, 0% used [0x00000000f1c80000,0x00000000f1c80000,0x00000000f8e40000)
 to space 116480K, 0% used [0x00000000f8e40000,0x00000000f8e40000,0x0000000100000000)
 PSOldGen total 699072K, used 699071K [0x00000000c0000000, 0x00000000eaab0000, 0x00000000eaab0000)
 object space 699072K, 99% used [0x00000000c0000000,0x00000000eaaafff0,0x00000000eaab0000)
 PSPermGen total 21248K, used 2409K [0x00000000bae00000, 0x00000000bc2c0000, 0x00000000c0000000)
 object space 21248K, 11% used [0x00000000bae00000,0x00000000bb05a740,0x00000000bc2c0000)
Anatomy of GC log Statement
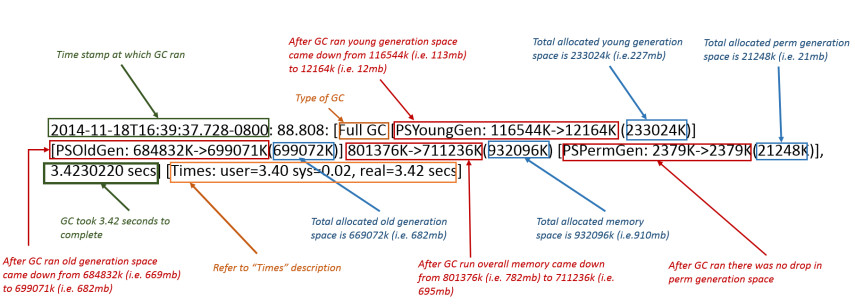
2014-11-18T16:39:37.728-0800: 88.808: [Full GC [PSYoungGen: 116544K->12164K(233024K)] [PSOldGen: 684832K->699071K(699072K)] 801376K->711236K(932096K) [PSPermGen: 2379K->2379K(21248K)], 3.4230220 secs] [Times: user=3.40 sys=0.02, real=3.42 secs]
Let’s pick up the one single log statement and examine each field in it:
2014-11-18T16:39:37.728-0800 – Time stamp at which GC ran
Full GC – Type of GC. It could be either ‘Full GC’ or ‘GC’
[PSYoungGen: 116544K->12164K(233024K)] – After GC ran young generation space came down from 116544k (i.e. 113mb) to 12164k (i.e. 12mb). Total allocated young generation space is 233024k (i.e.227mb)
[PSOldGen: 684832K->699071K(699072K)] – After GC ran old generation space came down from 684832k (i.e. 669mb) to 699071k (i.e. 682mb). Total allocated old generation space is 669072k (i.e. 682mb)
801376K->711236K(932096K) – After GC run overall memory came down from. Total allocated memory space is 932096k (i.e.910mb)
[PSPermGen: 2379K->2379K(21248K)] – After GC ran there was no drop in perm generation space
3.4230220 secs – GC took 3.42 seconds to complete
[Times: user=3.40 sys=0.02, real=3.42 secs] – Real is wall clock time – time from start to finish of the call. This is all elapsed time including time slices used by other processes and time the process spends blocked (for example if it is waiting for I/O to complete).
User is the amount of CPU time spent in user-mode code (outside the kernel) within the process. This is only actual CPU time used in executing the process. Other processes and time the process spends blocked do not count towards this figure.
Sys is the amount of CPU time spent in the kernel within the process. This means executing CPU time spent in system calls within the kernel, as opposed to library code, which is still running in user-space. Like ‘user’, this is only CPU time used by the process.
In your case if the CPU time (3.4 sec) is considerably higher than the real time passed (3.42 Sec), we can conclude that the GC was run using multiple threads.
Fig: Anatomy of Garbage Collection Log Statement. Click to enlarge
Tool to analyze GC Logs
It’s tedious to analyze GC logs in a text editor. HP JMeter is a great tool to analyze GC log files. Here is my article to walk you through HP Jmeter

