
In the earlier article we saw how to generate Heap Dump from the JVM. In this article we will see how to analyze a heap dump in detail using ‘jhat’ tool. It’s easier to explain Heap analysis process with an example Memory leak program.
public class Address {

	private String address1;

	private String address2;

	private String city;

	private String state;

	private String country;

	public Address(String city, String state, String country) {

		this.city = city;
		this.state = state;
		this.country = country;
	}
    :

}

Address.java

package com.tier1app.entity;

public class User {

	private String firstName;
	private String lastName;

	public User(String firstName, String lastName) {

		this.firstName = firstName;
		this.lastName = lastName;
	}

	:

	@Override
	public String toString() {

		StringBuilder builder = new StringBuilder()
		 			    .append(firstName)
		 			    .append(" ")
		 			    .append(lastName);
		return builder.toString();
	}

}

User.java

package com.tier1app;

import java.util.HashMap;
import java.util.Map;

import com.tier1app.entity.Address;
import com.tier1app.entity.User;

public class AddressBook {

	private Map<user, address=""> leakingMap = new HashMap<user, address="">();

	/**
	 * Keeps adding user and their address infinitely.
	 */
	public void addAddresses() {

		for (int counter = 0; ; ++counter) {

			User user = new User("fName" + counter, "lName" + counter);
			Address address = new Address("San Francisco", "CA", "USA");
			leakingMap.put(user, address);
			System.out.println("added: " + user);
		}
	}

	public static void main(String args[]) {

		new AddressBook().addAddresses();
	}
}

AddressBook.java
Here the program keeps adding ‘User’ and ‘Address’ object infinitely in to the HashMap in the AddressBook object. Once they are added, they are never removed from the HashMap. Thus this program suffers from Memory Leak and eventually it’s going to result in OutOfMemoryError.
How to start jhat?
jhat -J-Xmx -port
where
memory-size: JVM argument. memory size with which JVM needs to be launched
port-number: Port in which jhat web application can be accessed
file-path: Location of Heap dump file
Example:
jhat -J-Xmx2g -port 7001 /opt/workspace/tier1app/artifacts/LeakingMap/heapDump-2.bin
Note:It’s important that you pass appropriate -Xmx, otherwise jhat will result in OutOfMemoryError. If your heap dump size is very large, then you need to pass larger -Xmx argument size. If it’s not passed jhat will fail to start with below error:
Exception in thread "main" java.lang.OutOfMemoryError: Java heap space
        at com.sun.tools.hat.internal.parser.HprofReader.readInstance(HprofReader.java:735)
        at com.sun.tools.hat.internal.parser.HprofReader.readHeapDump(HprofReader.java:484)
        at com.sun.tools.hat.internal.parser.HprofReader.read(HprofReader.java:238)
        at com.sun.tools.hat.internal.parser.Reader.readFile(Reader.java:92)
        at com.sun.tools.hat.Main.main(Main.java:159)
jhat will take few (sometimes several) minutes to launch based on your heap dump size. Once heap dump is fully loaded you will see following message:
jhat -J-Xmx2g /opt/workspace/tier1app/artifacts/LeakingMap/heapDump-2.bin
Reading from /opt/workspace/tier1app/artifacts/LeakingMap/heapDump-2.bin...
Dump file created Fri Nov 14 23:38:02 PST 2014
Snapshot read, resolving...
Resolving 4101518 objects...
Chasing references, expect 820 dots.............................................
................................................................................
................................................................................
.......................................................
Eliminating duplicate references................................................
................................................................................
................................................................................
....................................................
Snapshot resolved.
Started HTTP server on port 7000
Server is ready.
Web Access – jhat
Open up your favorite browser and enter URL: http://localhost:7001, as you launched jhat in the port 7001. You will see the following screen:

Home page shows all the application packages, application class files and pre-defined queries. Since in our application there are only 3 clases – AddressBook, Address, User – only those classes are showing up here. Typically a real-world application will have several classes.
There are several views in the home page:
- All classes including platform
- Show all members of the rootset
- Show instance counts for all classes (including platform)
- Show instance counts for all classes (excluding platform)
- Show heap histogram
- Show finalizer summary
- Execute Object Query Language (OQL) query
Most important views that are useful for diagnosing problems are: “Show heap histogram” and “OQL”. Most of other views are redundant.
Heap Histogram
‘Heap Histogram View’ shows all the classes that are residing in the memory, their count and total size of all the objects of that particular class type.
By default all classes are sorted by the total memory size they occupy. I have always seen the leaking object to be one of the top 5 in the list. As leaking objects count is going to high.
In the top 5 classes, if you are able to see any classes size to be huge in count then it’s expected count than that is the class which is leaking in your application. If you are not sure about the expected count, then follow the next section (i.e. Two Heap Dumps)

Here you see our application objects i.e. com.tier1app.entity.Address, com.tier1app.entity.User and Java objects as well – String, Hashtable, HashMap, Object….. Along with it you are also seeing classes like C, I, L, B… what do they stand for?
Element Type  	Encoding
boolean	   	Z
byte	   	B
char	   	C
class 	   	Lclassname;
double	   	D
float	   	F
int	   	I
long	   	J
short	   	S

If this class object represents a class of arrays, then the internal form of the name consists of the name of the element type preceded by one or more '[' characters representing the depth of the array nesting.
Two Heap Dumps
Capture first heap dump right after application started. Then capture the heap dump after time period – ‘x’. Time period x depends on your application. Suppose if your application experiences outOfMemoryError in 3 hours after it has started, then x can be 2 hours (i.e. before it crashes). Or if you are using “-XX:+HeapDumpOnOutOfMemoryError -XX:HeapDumpPath=/logs/heapdump” system property then you don’t have to worry about time period ‘x’. As heap dumps would be generated when JVM experiences OutOfMemoryError.
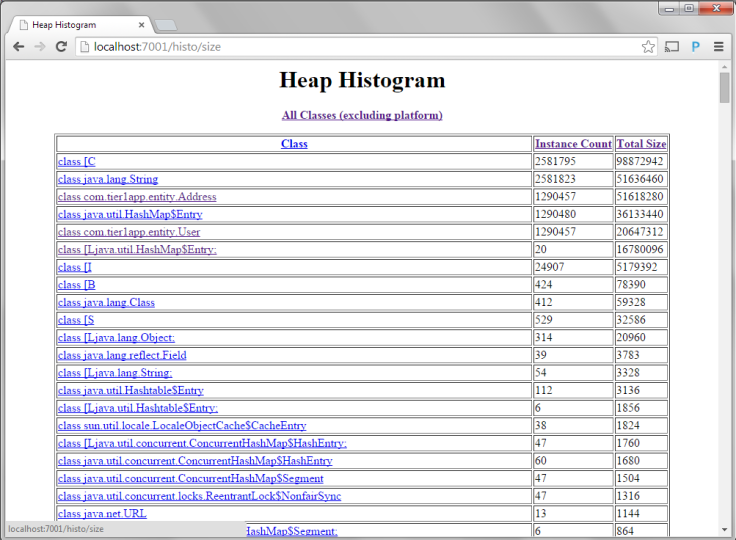
Now launch the second heap on a different port. And now compare the object counts between two heap dumps in the ‘heap histogram’ view. Now in this case you can see ‘User’ and ‘Address’ object count was 582982 in the first heap dump (which was captured right after application was started). Where as same objects count spiked up to ‘1290457’ in the second heap dump, which was captured several minutes after first heap dump. Object count almost doubled up.
Okay now we have identified leaking objects i.e ‘User’ and ‘Address’. Next step is to identify who is originating the leak i.e. which part of the code is causing the leak.
Who is originating the memory leak? – Roots Query
The roots query gives you reference chains from the rootset to a given object. It will give you one chain for each member of the rootset from which the given object is reachable.
Jhat sorts rootset reference chains by the type of the root, in this order:
- Static data members of Java classes.
- Java local variables. For these roots, the thread responsible for them is shown.
- Native static values.
- Native local variables.
Now let’s use ‘roots’ query to identify the originator of the memory in our application. Now from the home page click on the “class com.tier1app.entity.User”.
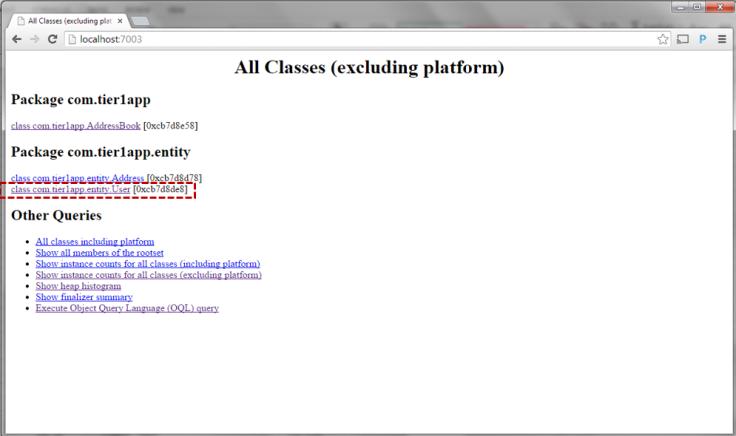
It will take you to the User class page. This page has all the details about the User class object. Now here click on any one of the object of User class. (See the red color highlight in the below picture).

Now you will be taken to page which will show the details about this particular User Object. It shows details about the Member Variables of this object, their values, who is holding references to this object, …..

Now in the browser’s address bar change the “object” to “roots” in the URL. So that URL will be changed from http://localhost:7003/object/0xc3d77b18 to http://localhost:7003/roots/0xc3d77b18. This page will show the root object that is holding reference to the current User object. See the below picture. It’s clearly illustrates the reference hierarchy.
AddressBook –> HashMap –>Array of HashMap$Entry –> HashMap$Entry –> User.
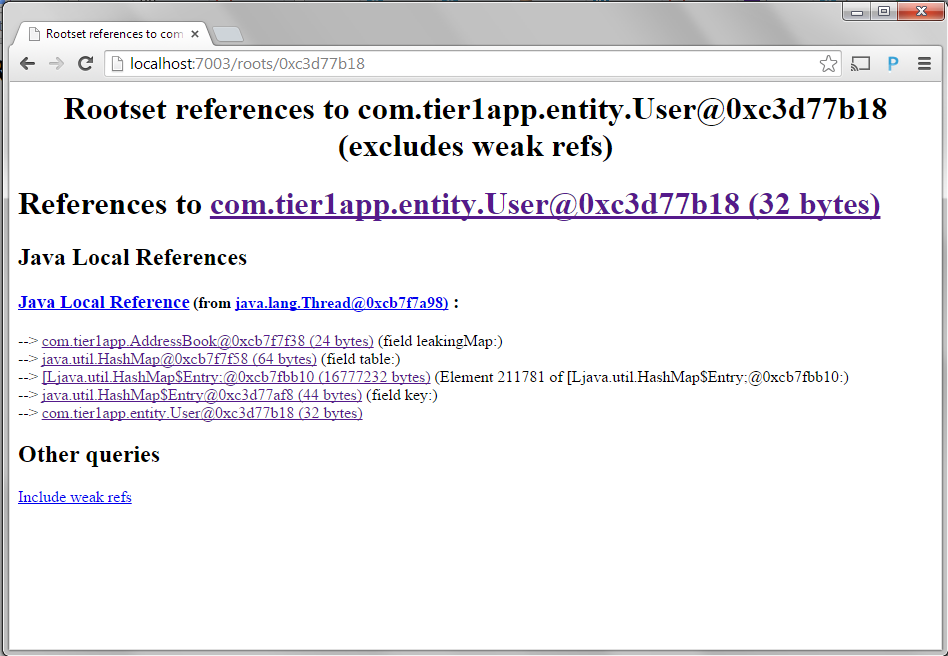
Bingo – now you can clearly see Address is the root object. It is originator of the memory leak.
Note: Depending on your application’s complexity and Object’s nested referencing nature, sometimes it might take several minutes (15 minutes) to load the “roots” page. So don’t prematurely close the browser window. Have patience.

It’s easier to enable verboseGC for the application and analyze it to identify a memory leak, instead of comparing 2 dumps.