Is your JVM experiencing Repeated Full GCs? Are you wondering what might have caused it? Are you struggling to fix it? Then you are reading right article. Then you are reading right article.
Repeated Full GCs happens for 2 reasons:
1. Application needs more memory
2. Memory Leak in application
How will you know for which of the above reason consecutive Full GC is happening in your application?
1. Application needs more memory
Some applications might need more memory then allocated memory only at certain points of its execution and not always. In such cases, consecutive Full GCs would happen only during those points and JVM would be able to recover to normal behavior after those execution points are crossed.

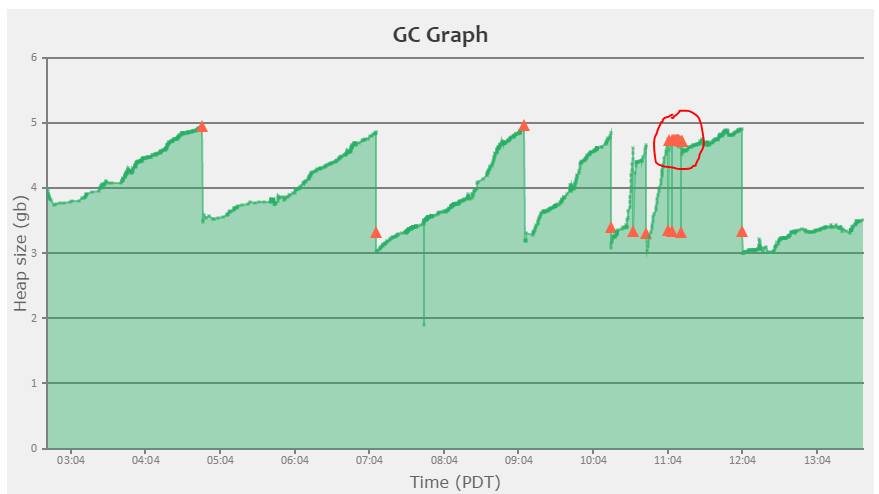
Fig: Showing full GC at 11:04, due to insufficient memory allocation
Red marks indicates the graph indicates the occurrence of Full GC.
Above is the GC graph of an application that was suffering from consecutive GCs. This diagram was generated by Tier1App’s Universal GC Analyzer by parsing the GC log of the application.In the graph note the red color circle, where consecutive Full GCs were happening. After few minutes, application was able to recover and resume it’s execution properly.
Allocating additional heap size (-Xmx) helped to fix this problem. In some cases Perm Generation might also be in need of additional memory. In such circumstance increase the value of (–XX:PermSize)
2. Memory Leak in application
If application is suffering because of reason #2 “Memory Leak in the application” – increasing JVM heap size (-Xmx) & Perm Gen Size (–XX:PermSize) wouldn’t solve your problem. Still you will experience seeing consecutive Full GCs.
When application is suffering from consecutive Fulls GC because of reason #2, it won’t be able to recover (like above graph). It will just become unresponsive. Only way to recover from the problem is to restart the JVM. Where as in the above case there is a chance for application to recover from consecutive Full GC after memory consuming execution points are crossed.
Below is the GC graph of an application wasn’t able to recover from consecutive Full GCs. Note the repeated red marks towards the end of the graph.
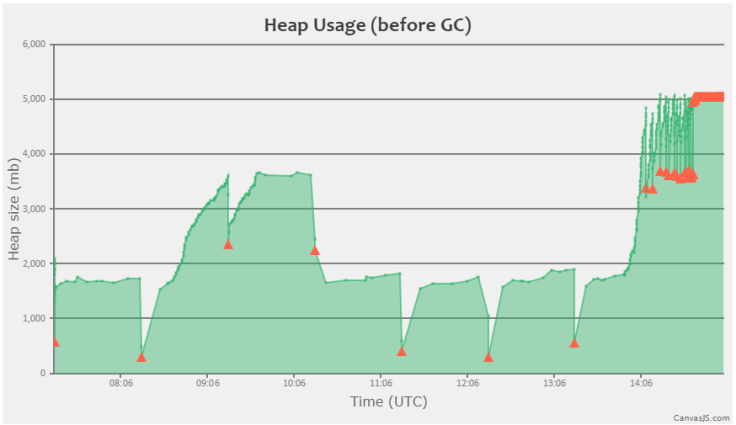
Under this circumstance, only way to re-mediate problem is to: diagnose the Memory leak & fix it. If you need assistance in fixing your memory problems, you can always reach out to me.
