
I was asked to look the memory utilization of an application. This application was running on Solaris 5.10.
This application was running with following Java arguments for generating garbage collection logs, along with other system properties:
“-Xloggc:$INSTANCE_DIR/logs/gc.$DATESTAMP.log -verbose:gc -XX:+PrintGCDetails -XX:+PrintGCApplicationStoppedTime -XX:+PrintGCDateStamps -XX:+PrintTenuringDistribution”
This kind of setting was generating a garbage collection log whose contents was looking something like:
Total time for which application threads were stopped: 0.0006726 seconds
Total time for which application threads were stopped: 0.0004909 seconds
Total time for which application threads were stopped: 0.0007350 seconds
2013-05-13T05:57:54.738-0500: 42.879: [GC 42.880: [ParNew
Desired survivor size 53673984 bytes, new threshold 1 (max 15)
– age 1: 63153296 bytes, 63153296 total
: 838912K->61795K(943744K), 0.1826602 secs] 838912K->61795K(2496128K), 0.1829831 secs] [Times: user=0.99 sys=0.14, real=0.18 secs]
Total time for which application threads were stopped: 0.1844255 seconds
Total time for which application threads were stopped: 0.0050079 seconds
Total time for which application threads were stopped: 0.0007418 seconds
Total time for which application threads were stopped: 0.0025281 seconds
Total time for which application threads were stopped: 0.0031622 seconds
Total time for which application threads were stopped: 0.0025294 seconds
Total time for which application threads were stopped: 0.0028731 seconds
2013-05-13T05:58:50.380-0500: 98.520: [GC 98.521: [ParNew
Desired survivor size 53673984 bytes, new threshold 1 (max 15)
– age 1: 66927936 bytes, 66927936 total
: 900707K->70679K(943744K), 0.3438052 secs] 900707K->132493K(2496128K), 0.3442627 secs] [Times: user=2.28 sys=0.31, real=0.34 secs]
Total time for which application threads were stopped: 0.3484891 seconds
Total time for which application threads were stopped: 0.0013288 seconds
Total time for which application threads were stopped: 0.0042658 seconds
Typically I use HPJMeter to review Garbage Collection logs. HPJmeter is a great tool to look at GC logs visually. However HPJMeter couldn’t parse the log file which was in above format. So I had to play around a little bit to figure out an tool which can genrate graphs from the GC Logs. I ended up figuring out couple of options.
OPTION #1:
IBM Pattern Modeling and Analysis Tool for Java Garbage Collector
1. Downloaded IBM Pattern Modeling and Analysis Tool for Java Garbage Collector tool.
2. From the GC log file, removed all the statements which were saying
“Total time for which application threads were stopped:…”
3. So now the GC log file would look like this:
2013-05-13T05:57:54.738-0500: 42.879: [GC 42.880: [ParNew
Desired survivor size 53673984 bytes, new threshold 1 (max 15)
– age 1: 63153296 bytes, 63153296 total
: 838912K->61795K(943744K), 0.1826602 secs] 838912K->61795K(2496128K), 0.1829831 secs] [Times: user=0.99 sys=0.14, real=0.18 secs]
2013-05-13T05:58:50.380-0500: 98.520: [GC 98.521: [ParNew
Desired survivor size 53673984 bytes, new threshold 1 (max 15)
– age 1: 66927936 bytes, 66927936 total
: 900707K->70679K(943744K), 0.3438052 secs] 900707K->132493K(2496128K), 0.3442627 secs] [Times: user=2.28 sys=0.31, real=0.34 secs]
2013-05-13T05:59:59.152-0500: 167.292: [GC 167.296: [ParNew
Desired survivor size 53673984 bytes, new threshold 1 (max 15)
– age 1: 100958912 bytes, 100958912 total
: 908123K->104832K(943744K), 0.7328639 secs] 969937K->238206K(2496128K), 0.7333427 secs] [Times: user=4.09 sys=0.21, real=0.74 secs]
4. Opened this file in the IBM GC analyzer tool that was downloaded in step #1, using the command:
java -jar ga446.jar
5. It generate graphs from the GC log. See the below picture:
Option #2: Garbage Cat & HP JMeter
1. Downloaded Garbage Cat tool
2. Ran the following command:
java -jar C:\tools\garbagecat-1.0.1.jar -p gc.2013-05-13.05.39.log
where gc.2013-05-13.05.39.log is the name of the original GC log file.
3. It generated a file called: gc.2013-05-13.05.39.log.pp
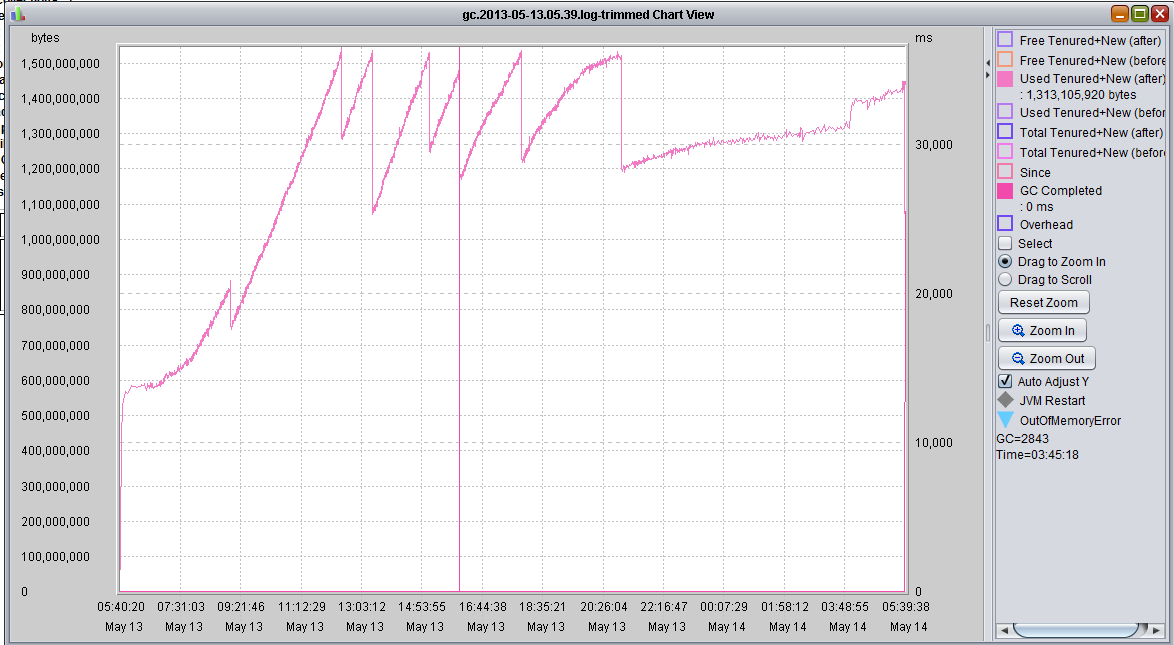
4. Opened this gc.2013-05-13.05.39.log.pp file in HPJmeter. Now HPJmeter was able to parse the log file and generate wonderful graph, that you can see below:


Leave a comment